Disclaimer: Each reading follows a simple published rule on public data. Together they describe the data; they are not a price forecast or a recommendation, and the data may be late or wrong. For education and research only. Use at your own risk. Not financial advice.
Palm Oil at a Glance
This site tracks palm oil from a dozen angles. This page puts the key reading from each on one screen, sorted into supply, demand, prices and the weather outlook, and says what they add up to. Each card links to the page with the detail.
Loading…
The palm oil world right now
Where the oil is grown, where it goes and where it is priced. A big dot is green if that place's data support palm prices, red if they weigh on them; small dots show rain in the palm belts over the last three months; arrows are the main export routes. Click a dot: a pop-up names the place and its key numbers, with the full detail below the map.
All trade numbers on the map are USDA's yearly forecasts for the same season: exports for Malaysia and Indonesia, imports for the five biggest buyers, so they compare like for like. The buyers shown take about half of world imports; the rest is in the bar below. The percentage is each country's share of world exports or imports. Prices are shown only where a free, published palm oil price exists: FOB Malaysia (World Bank, monthly average) and CIF India (SEA, monthly average), in US dollars and in ringgit at Bank Negara's average USD/MYR rate for the same month; other buyers' panels give a competing oil's price for comparison. Arrows show the main export routes, not volumes. Click a place for monthly figures from MPOB, GAPKI and SEA, each labelled as one month.
Where the exports go
How palm oil prices connect: futures, local, FOB and CIF
The same tonne of crude palm oil has a different price at each step from a Malaysian tank to a buyer's port. Each step adds a cost; nothing else changes.
| FCPO futures, spot month | FOB price | |
|---|---|---|
| Where the oil is | Port tanks in Malaysia (Port Klang, Pasir Gudang, Penang/Butterworth) | On board the ship at the export port |
| Currency | Ringgit per tonne | US dollars per tonne |
| Export duty | Not included | Included |
| Product | Crude palm oil | Crude oil, or mostly refined olein for Malaysian exports |
| Timing | Delivery any day in the contract month | A shipment month, under trade contract terms |
| What keeps it in line | Physical delivery: if futures drift from local prices, traders deliver or take delivery until they meet | Futures in US$ + export duty + loading costs + exporter premium |
The market's benchmark is the third month, not the spot month, which is thinly traded near expiry. Compare a futures month with the FOB shipment month it matches, since later months are often priced higher or lower.
Why India pays more than FCPO: from RM4,049 to RM4,714, and RM5,221 in September
A worked example on 6 November 2026. BMD FCPO is untaxed oil in Malaysian port tanks; India's price is the same oil after export duty, freight and insurance, delivered to Mumbai. The last line shows why September's average was higher still.
| Step along the export chain | US$/t | RM/t | Source |
|---|---|---|---|
| BMD FCPO November contract, settlement 6 Nov | 1,001 | 4,049 | Bursa Malaysia Derivatives |
| + Malaysian export duty, 10% of the monthly reference price | +109 | +440 | Malaysian Customs; 10% applies above RM4,050 (approximate) |
| + Exporter premium and basis | +6 | +23 | Balancing item |
| = CPO FOB, loaded on the ship | 1,115 | 4,512 | SEA daily rate, CPO FOB Indonesia, 6 Nov |
| + Freight and insurance to Mumbai | +50 | +202 | SEA C&F minus FOB |
| = CPO C&F Mumbai, 6 Nov (India's price on the map that day) | 1,165 | 4,714 | SEA daily rate |
| + Prices were higher in September (and the ringgit slightly weaker) | +120 | +507 | SEA monthly average against the 6 Nov rate |
| = CPO CIF India, September average (SEA monthly) | 1,285 | 5,221 | SEA monthly average |
Ringgit at Bank Negara's USD/MYR rate: 4.0465 on 6 November, 4.0632 for the September average. On the same day the real gap between FCPO and India's delivered price is about RM670: roughly RM440 of duty, RM200 of freight and a small premium. The other RM500 or so is September's higher prices. The duty depends on November's reference price, so it and the premium are approximate. Updated by hand.
India import margin today
Does it pay to import crude palm oil into India? The landed cost of a tonne bought C&F Mumbai, against what the same oil sells for locally at Kandla. Built only from public data and updated each working day.
| Step | Rs/t | US$/t | Source |
|---|
1. Supply now
How much oil there is: stocks and output in the two big producers, and the next MPOB report.
2. Demand
Who is buying: Malaysia's exports, India's and China's imports, and biodiesel.
3. Prices and value
Whether palm is cheap or dear against the oils and fuel it competes with, and how it has been trading.
4. Outlook: weather, 6 to 12 months ahead
Dry weather cuts palm output with a long lag, so today's weather is next year's supply.
Go deeper
Every palm oil page on the site, by theme.
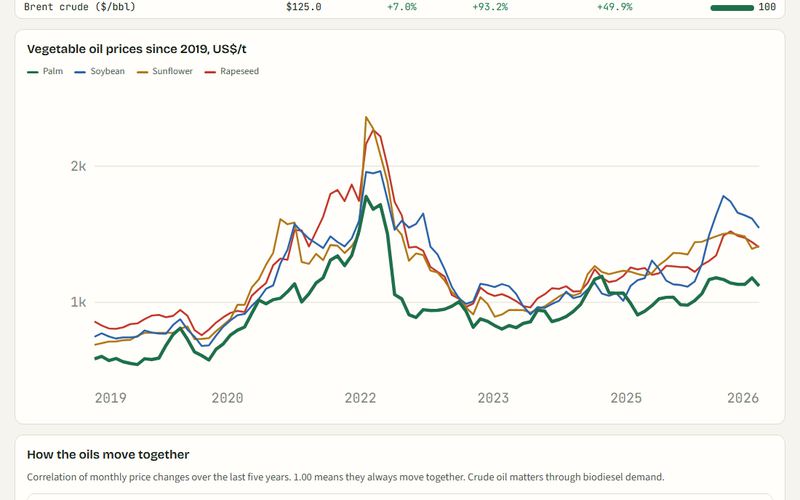 PricesPalm Oil Market MonitorScorecard, spreads, valuation, El Niño
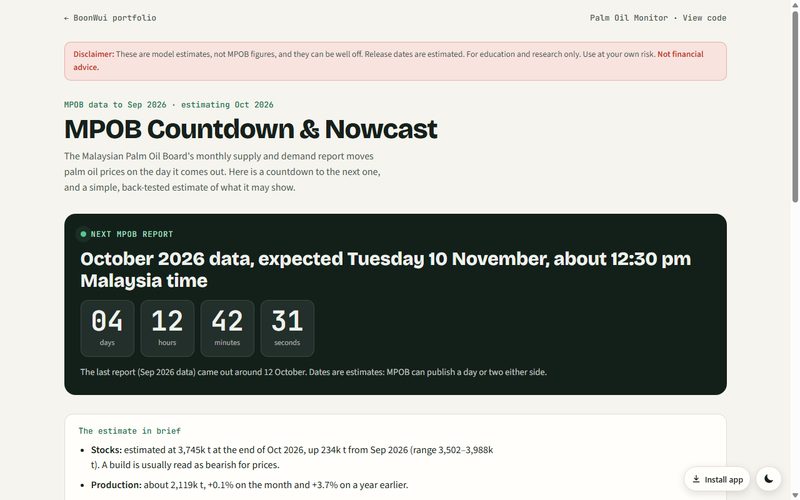 SupplyMPOB Countdown & NowcastNext report, forecast, track record
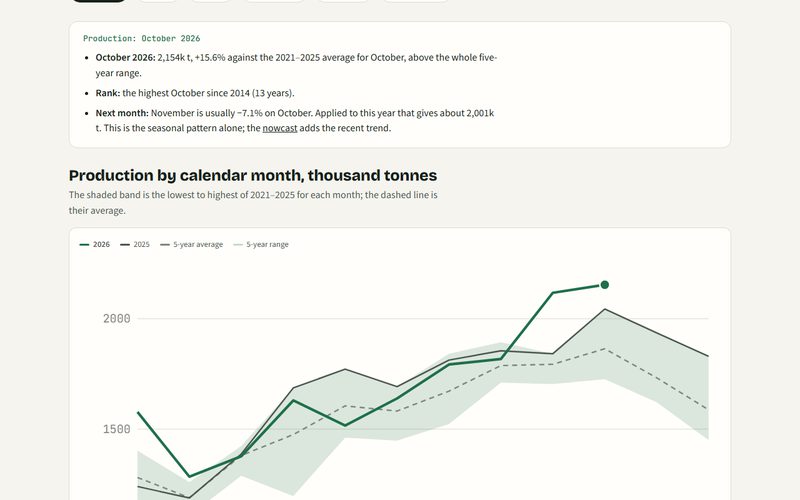 SupplySeasonalityThis year against the last five
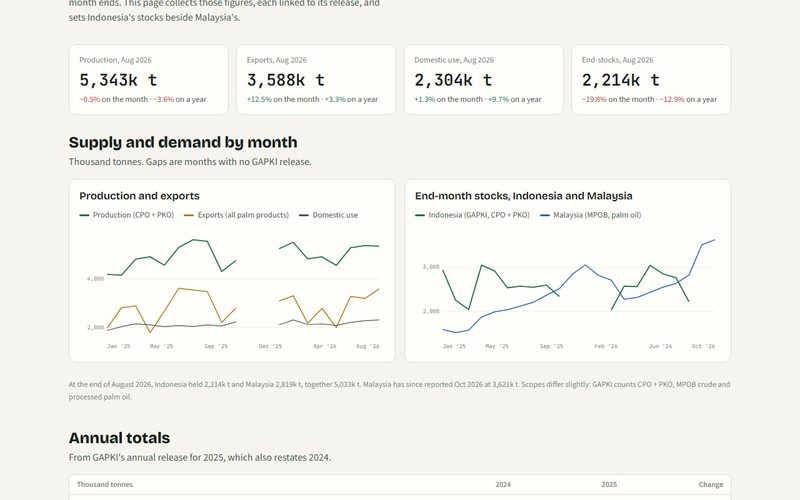 SupplyIndonesia TrackerGAPKI monthly balance
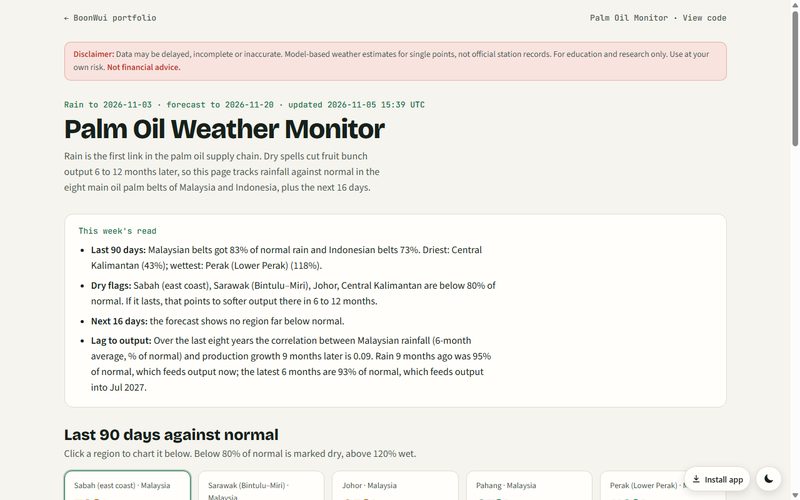 SupplyWeather MonitorRain in the palm belts
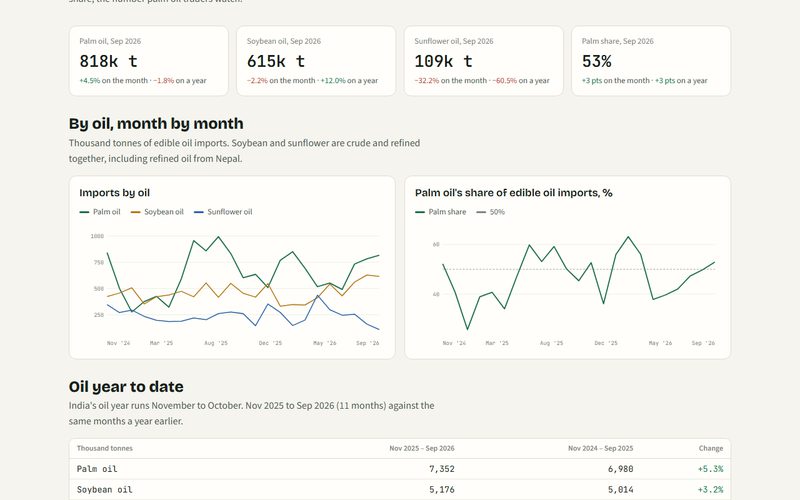 DemandIndia ImportsPalm against soy and sunflower
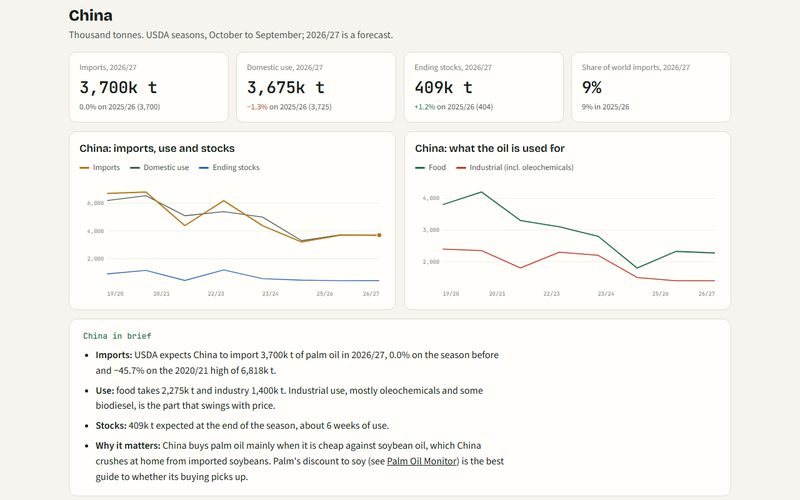 DemandWorld Palm DemandChina, India and the big buyers (USDA)
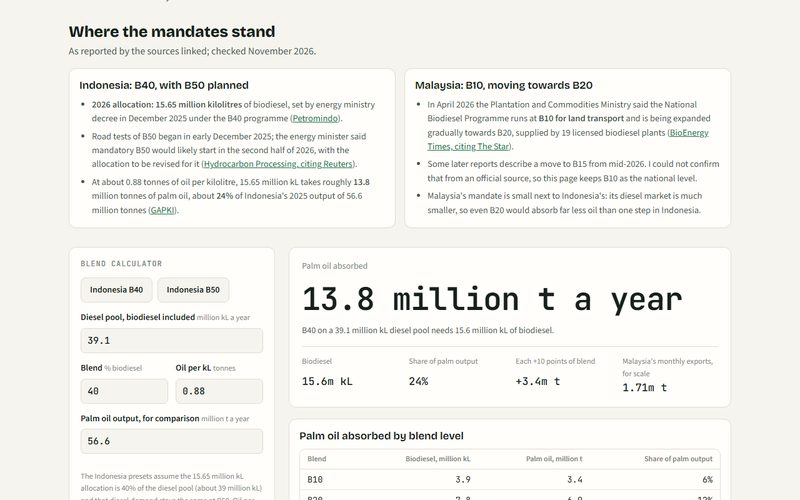 DemandBiodiesel TrackerMandates and the oil they absorb
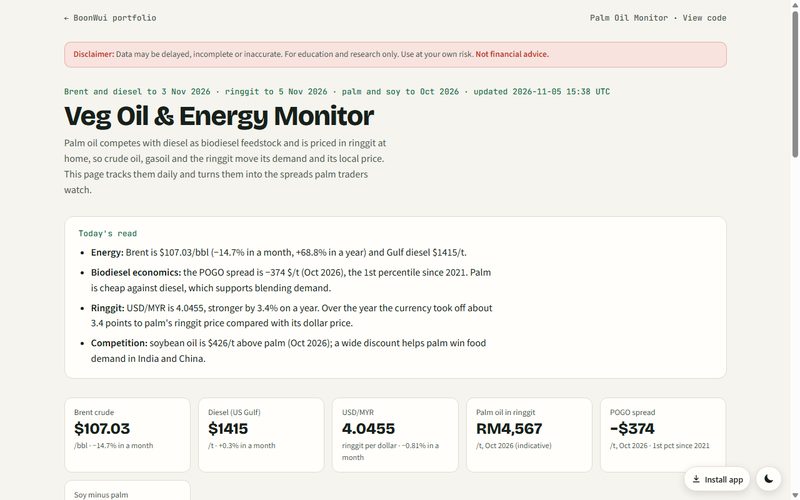 DemandVeg Oil & Energy MonitorPOGO, Brent and the ringgit
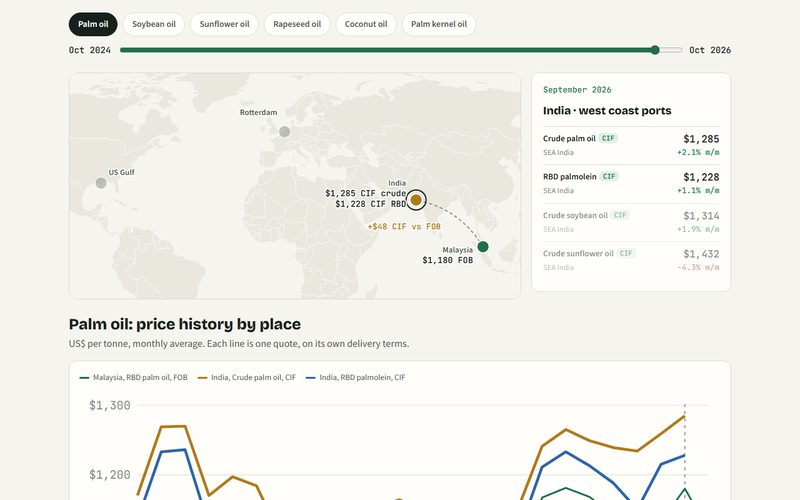 PricesVeg Oil Price MapFOB, CFR and CIF by port
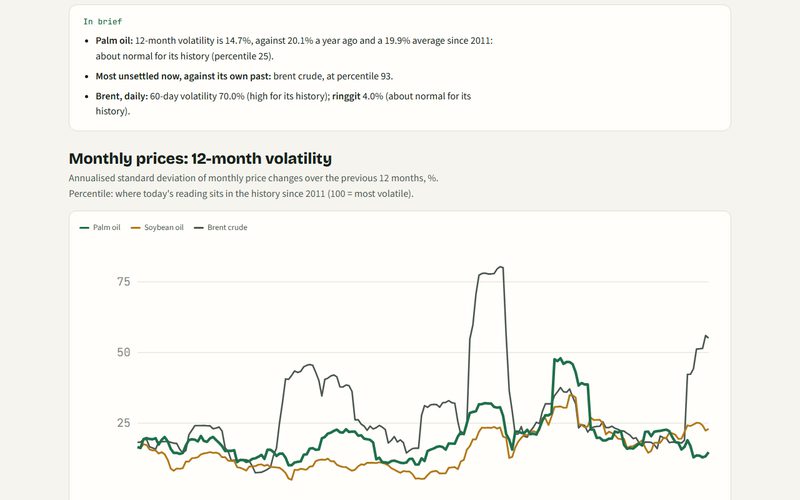 PricesVolatilityHow jumpy prices are
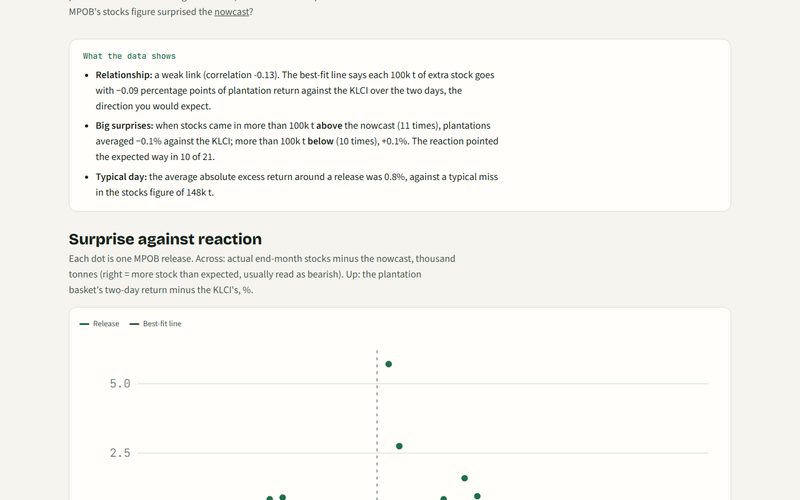 PricesMPOB Day Event StudyHow plantation shares react
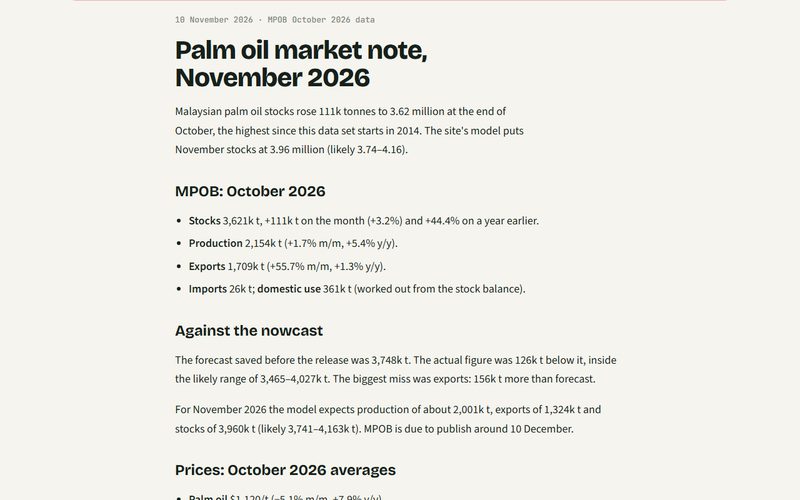 Write-upsPalm market notesOne each MPOB release day
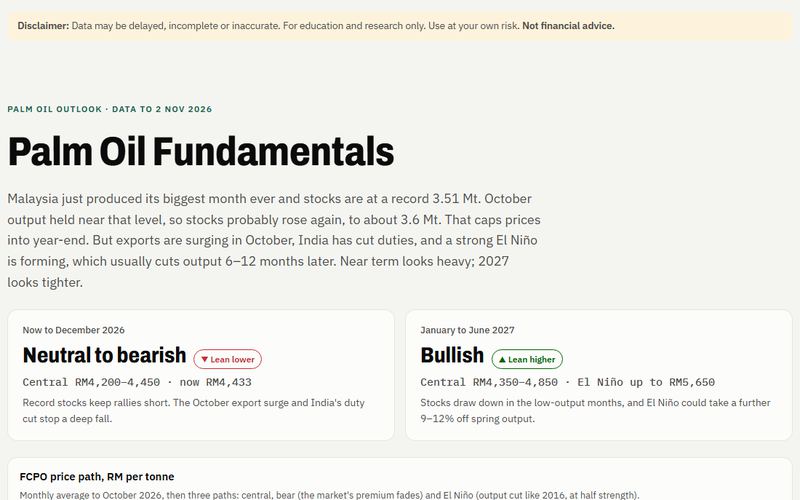 OutlookPalm Oil FundamentalsThe longer outlook to mid-2027
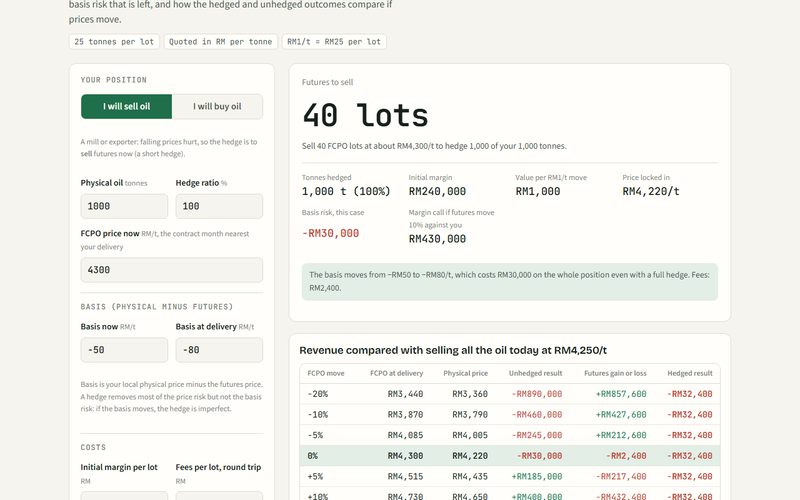 ToolFCPO Hedging CalculatorLots, margin and basis risk